Glossary
"Using the right word, the right idea, the right concept, with the most commonly accepted definition, or even better, with the best accepted and understood definition, can sometimes be a feat...”
Patrick Triplet
> With this quote, we wish to pay tribute to the colosal work of this biologist, and doctor of ecology whose great oeuvre, “Dictionnaire encyclopédique de la diversité biologique et de la conservation de la nature” (The Encyclopaedic Dictionary of Biological Diversity and Nature Conservation) ─ compiled over the course of more than ten years ─ is the basis of many of the definitions found in this glossary. Indeed, it is by using a language with precise words and clearly defined concepts that everyone and anyone can approach and understand fields of study that may not necessarily be within their own expertise.
> This glossary of over 6,000 definitions, written in French with corresponding English translations, is here to help you. It covers the complementary fields of Geography, Ecology, and Economics, without forgetting a small detour into the world of Finance, which of course regulates a large part of our existence.
> Travelling from one definition to another, this glossary invites you to explore the rich world of conservation and to understand its mechanisms and challenges.
We wish you all : "Happy reading and a safe journey through our world".
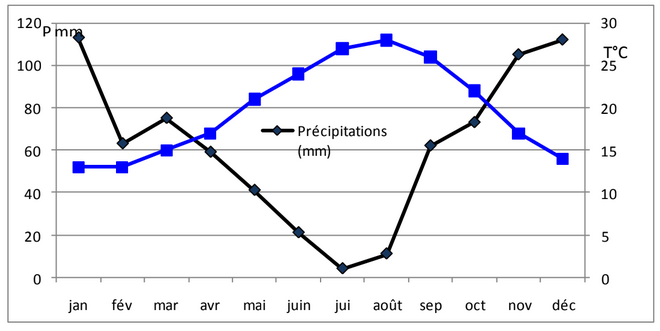
Diagramme ombrothermique de Bagnouls et Gaussen
Glossaries
| Term | Definition |
|---|---|
| Diagramme ombrothermique de Bagnouls et Gaussen | ♦ Outil graphique qui consiste à confronter deux paramètres majeurs du climat, la température et les précipitations.
On considère qu'on a un mois sec quand l'histogramme des précipitations est sous la courbe des températures. À l'inverse, un mois est considéré comme humide quand l'histogramme des précipitations dépasse la courbe des températures. L'amplitude thermique est la différence entre la température maximale et la température minimale. Les données obtenues permettent de définir les climats. Équivalent étranger : Gaussen ombrothermal diagram. |